13. Log
The log module includes eight interfaces, namely HMI logs, controller logs, operation logs, log timelines, internal logs, diagnostic settings, hardware status, and diagnostic data monitoring.
13.1 HMI logs
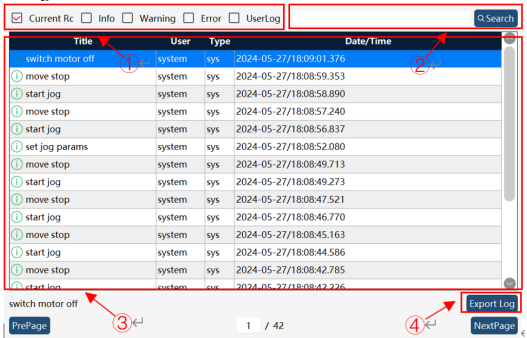
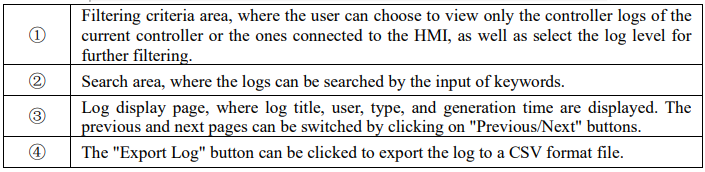
The HMI logs interface displays the current user's HMI operation log information, and this interface includes filtering criteria area, search area, display page, etc. The user can click "Export Log" to export the desired HMI log information.
13.2 Controller logs
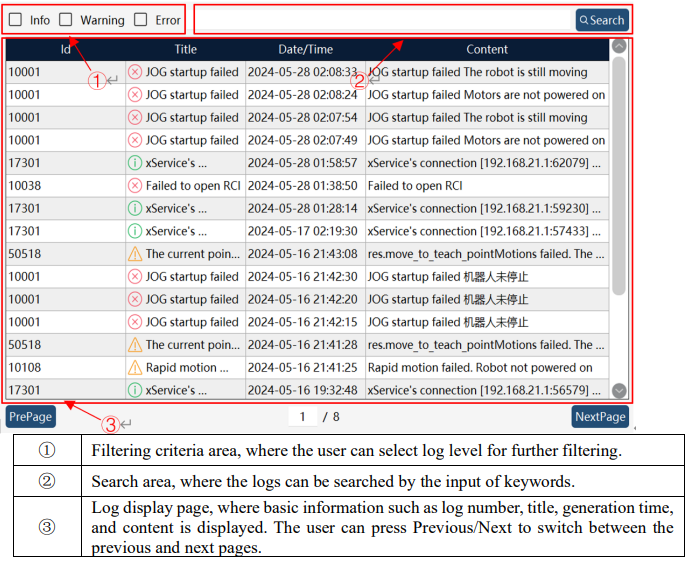
The controller logs interface displays the controller log information of the current robot, and this interface includes filtering criteria area, search area, and display page. The User can view the controller log information here.
13.3 Operation logs
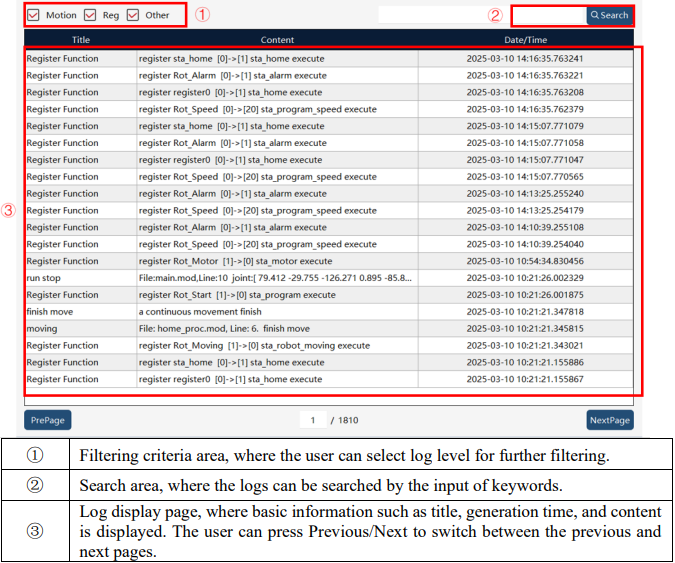
Compared with controller logs, operation logs mainly record the key commands that the robot has executed, including the following information:
1. Start and stop of the robot and execution of motion commands
2. Execution of two logical commands IF-ELSE and WAIT UNTIL
3. Execution of commands SetDO\PulseReg\PulseDO
4. JOG, drag, and regain path
5. Emergency stop, pause, and start
6. Register status codes output externally, and control codes received from external controllers
7. Changes in safe regions
8. Triggering of functions such as collision detection and diagnostic data saving
9. External data read by communication commands
13.4 Log timeline
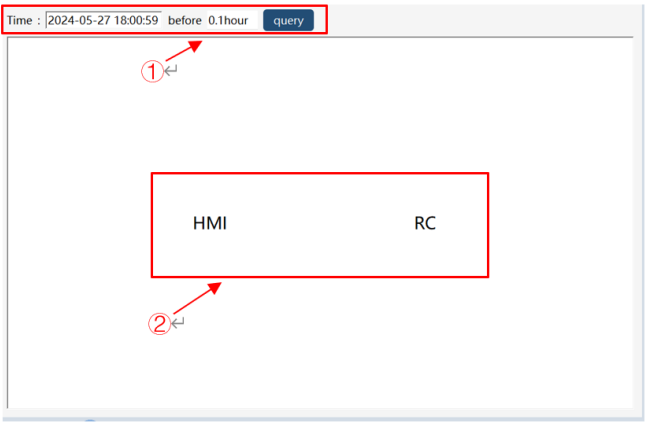
The log timeline interface displays both HMI and controller log information in chronological order, and this interface includes search area and display page, allowing the user to search for HMI logs and controller logs at different time periods.

13.5 Internal logs
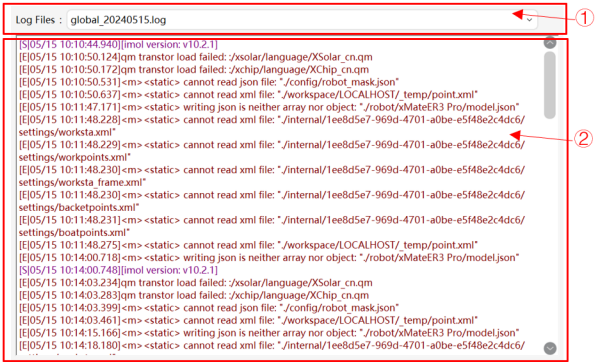
The internal logs interface has functions such as providing a basis for troubleshooting technical issues, robot malfunctions, etc. and pinpointing the cause of problems, and this interface mainly includes search area and display page.

13.6 Hardware status
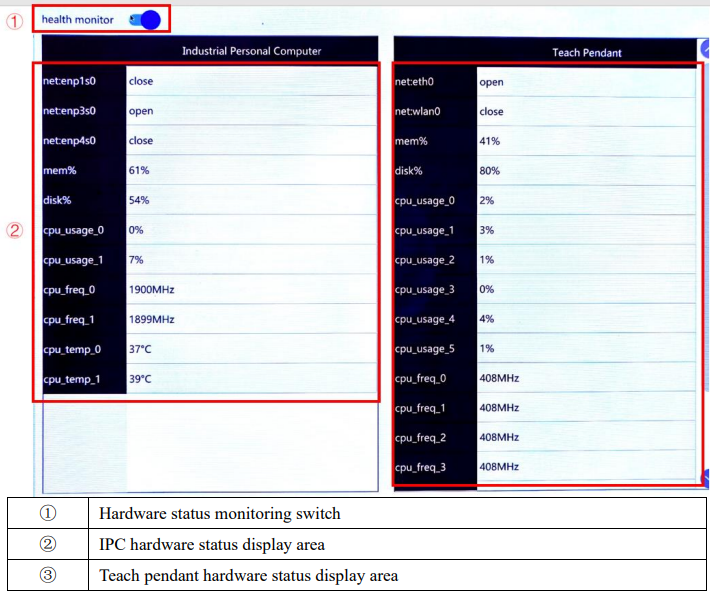
It is used to monitor the hardware status of the IPC and the teach pendant, including memory usage, disk usage, network adapter status, CPU frequency, temperature, and usage. The interface consists of an enable switch, an IPC hardware status display area, and a teach pendant hardware status display area.
13.7 Diagnostic setting
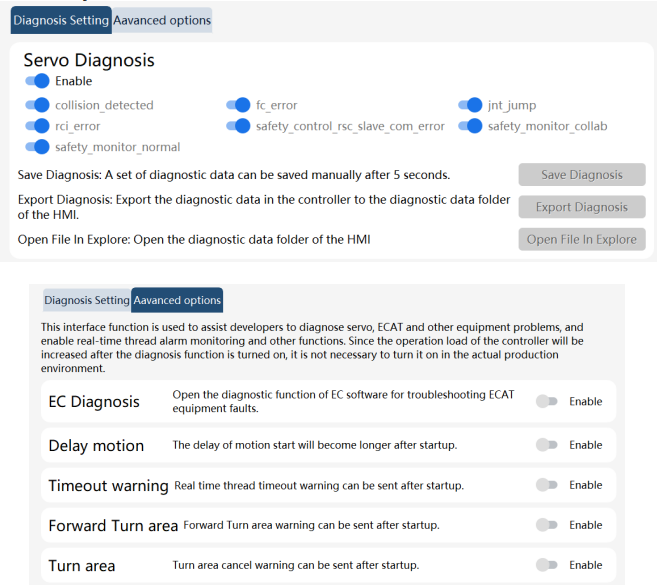
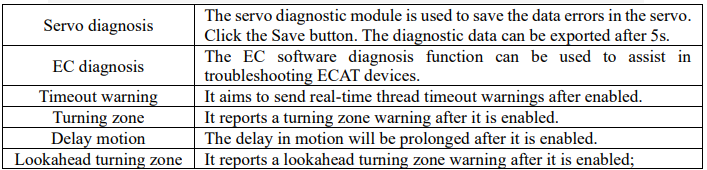
This interface is used to assist developers with the diagnosis of the servo, ECAT, and other equipment, and enable real-time thread alarm and monitoring and other functions. Since enabling the diagnostic function will increase the workload of the controller, do not turn it on in actual production unless necessary.