
7. Acquisition and Live View
You can start image data acquisition and view the live video of a single machine vision camera or the live video of multiple machine vision cameras simultaneously. And during the live view, you can determine the optimal image quality and perform operations such as recording video, capturing pictures, and zooming in or out.
Acquisition and live view are two different concepts:
Acquisition
The process in which the camera acquires image data.
Live View (or Live Video)
The display of live images by rendering the image data acquired by the camera.
7.1 Acquisition and Live View in 1-Window Mode
If the live view window is under 1-window mode, perform the following steps to start and stop live view.
Steps
Note
For details about how to set the window division mode, see Window Division for details.
1. Connect camera(s) to the Software.
2. Select Normal or Test in the upper-left corner as the camera's running mode.
Note
For details about running mode, see Running Mode.
3. Optional: Click  to control the trigger mode of the camera.
Note
You can set trigger source and other related parameters in Input settings. For details, see Input.
4. Click  on the control toolbar to start acquiring image data from the camera.
Note
The image may vary with devices with different firmware versions.
5. Optional: Click  to stop live view if you only need to acquire streams from the camera. Click
  to resume live view
Note
After the live view is stopped, the acquisition still goes on.
6. Optional: Click  in the lower-right corner of the image to display the thumbnail and click the button again to hide it.
7. Stop acquisition.
– Click  to stop acquiring image data from the currently selected camera.
– Right-click the camera on the camera list and click Stop Acquisition to stop acquiring
streams.
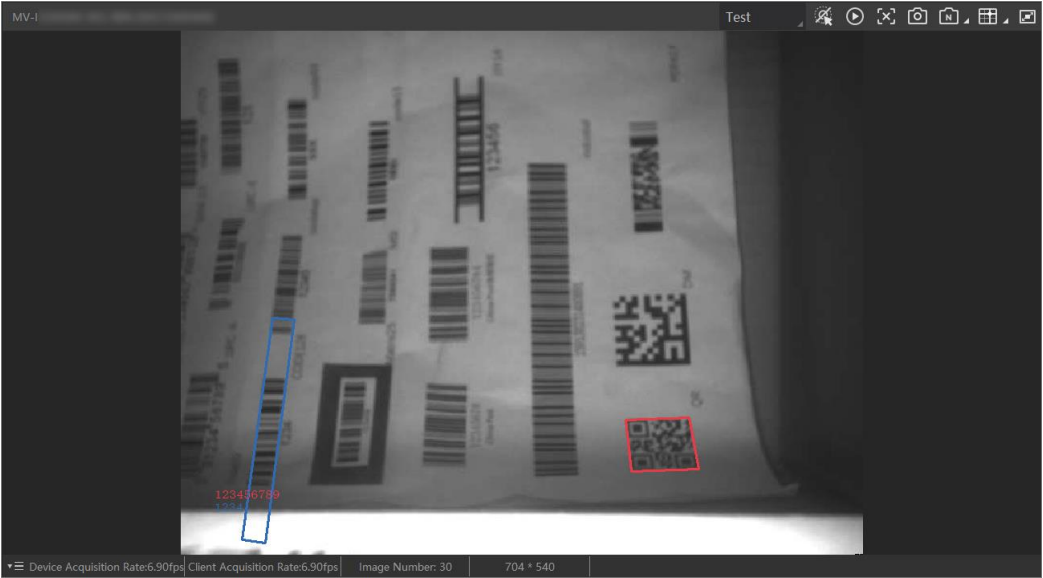
Note
The live view of IDX series code reader will be displayed in multi-channel mode by default. And you can click  to switch to 1-channel mode.
7.2 Multiple-Camera Acquisition (and Live View)
You can start and stop the live view of multiple devices in batch. In this mode, you can view the live videos of multiple cameras simultaneously.
Steps
1. Connect camera(s) to the Software.
2. Click  , and then select a multiple-division mode.
Note
For details about how to set the window division mode, see Window Division for details.
3. Drag the connected camera(s) from the device list to the display window(s) to view the camera's live video.
4. Click  to start acquiring image data from the connected cameras simultaneously.
5. Optional: Drag the tile bar of a display window to adjust the sequence of the windows.
6. Optional: Move the cursor to the lower part of the live video image, and then click on the appeared toolbar to stop live view of the selected camera.
Note
After live view being stopped, acquisition still goes on.
7. Click  to batch stop acquisition.
7.3 View Live View in Full Screen
You can view live view in full screen in both 1-window mode or multiple-window mode. In multi-window mode, you can right-click the image and then click Full Screen to enter the full screen mode. Right-click the image and then click Exit Full Screen to exit full screen mode. You can also enter the full-screen mode via the keyboard shortcut (F4 by default). In 1-window mode, double-click the image to enter or exit the full-screen mode, or enter the full-screen mode via the keyboard shortcut (F4 by default), or click View → Full Screen to enter the full screen mode.
For both multi-window mode and 1-window mode, you can press Esc on the keyboard to exit the full screen mode.
7.4 Output Data to a Document
If the focus print is enabled, the Software can output code reading results to a document. Go to Settings → Code Draw, and then enable Focus Print. Start acquisition, and then open an editable document. The code reading results will be written in the document automatically. You can go to the Code Draw page to enable the Focus Print Enter or Focus Print Line Feed to output return symbols or line feeds in the document. See Code Draw.
7.5 View Reading History
During live view or acquisition in 1-window mode, you can view the barcode reading history of the device in real time, including the barcode output time, barcode recognized time, barcode type, the barcode content, and the detailed image of the waybill (if supported). For a DM code, you can also view its quality grade, including overall grade and grade based on each quality parameter.
Steps
1. Connect a device to the Software.
2. Optional: You can choose to enable Auto Path, which will automatically save the reading history to the default saving path, or enable Continuous Saving, which will continuously save the reading history. See details in History Export Settings.
3. Start live view or acquisition in 1-window mode to parse the barcodes.
Note
For details, see Acquisition and Live View in 1-Window Mode and Multiple-Camera Acquisition (and Live View).
4. Click  on the lower-right to display the History panel.
You can view the barcode reading history of the device on the History panel, including the No., read time, trigger index, trigger time, output total cost time, cost time, PPM, barcode type, waybill cutout, barcode content, code length, overall grade, code score, and lost packets.
Note
You can right-click on the column item to customize the items to be displayed.
Output Total Cost Time
The total time cost to acquire images and output barcode information (unit: ms).
Cost Time
The time cost to read and get information of a barcode (unit: ms).
Note
The parameter should be supported by the device.
PPM
Pixels per module. It equates to how many pixels can be laid across each barcode module.
Note
The parameter should be supported by the device.
Barcode Type
The OCR reading information is displayed in this column.
Code Score
The score of 2D code quality rating. See 2D Code Algorithm for instructions on enabling code quality rating.
Note
Right-click the column name of the History or click  on the top right of the History to configure columns to display.

Figure 7-2 History Panel
5. Perform the following operations if required.
● View Cutted-out Waybill Image: Click View in the Waybill Cutout column to view cutted-out waybill image when Waybill Cutout is enabled.
Note
○ The function should be supported by the device.
○ For details about enabling Waybill Cutout, see Enable Waybill Cutout.
● Export Reading History: Stop live view or acquisition, and then click History Export on the top to save the history in the local PC.
Note
○ The default saving path is C:/Users/The Current System Account/IDMVS/Data/History.
○ The default name of the exported file is "Device Model (serial No.)"; And the default file format is CSV.
○ You can set the saving path and format for the exported file. For details, see History Export Settings.
○ You can enable Continue Save in the History Export setting panel. For details, see History Export Settings. After it is enabled, the reading history will be continuously saved to the same file after you click  once.
once.
● Clear Reading History: Click  to clear all reading history.
● View Quality Grade of DM Code: Click the overall grade, which is graded based on ISO/IEC 15415 or ISO/IEC TR 29158, in the Overall Grade column, to view the grade of each quality parameter.
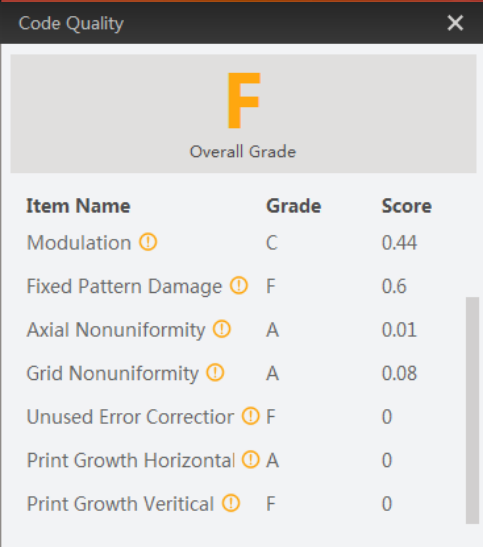
Figure 7-3 Code Quality
Note
○ The function should be supported by the device.
○ For details about changing ISO standards on code quality rating, see 2D Code Algorithm.
○ The overall grade is determined by the lowest grade of the quality parameters (excluding Print Growth Horizontal and Print Growth Vertical) in the table below.
| Quality ParameterDescriptionDecodeEvaluate whether decoding is possible or not for the DM code. The greater the possibility, the higher the grade will be. Symbol ContrastEvaluate the difference between the maximum brightness value and maximum darkness value in the DM code. The bigger the difference, the higher the grade will be. ModulationEvaluate the variation degree in cell brightness. The parameter is usually used to evaluate if there're stains on the DM code. If there're stains, the variation degree will be low, which results in low grade. Fixed Pattern DamageEvaluate the intactness of the finder bar (i.e., the L sides of the DM code), or clock pattern (the dotted sides). The more intact the finder bar or clock pattern, the higher the grade will be.Axial Non uniformityEvaluate the distortion degree in vertical and horizontal size of the DM code. The lower the distortion degree, the higher the grade will be. Grid Non-uniformityEvaluate the biggest deviation from the grid. The bigger the deviation, the lower the grade will be.Unused Err. CorrectionEvaluate the amount of available Error Correction at the time of decoding. The more available Error Correction, the higher the grade will be.Print Growth HorizontalEvaluate the print deviation (Overprint or Underprint) of the DM code in the horizontal direction. The less the deviation, the higher the grade will be. | NoteThe grade based on this parameter is not included in the overall grade. |
| Print Growth VerticalEvaluate the print deviation (Overprint or Underprint) of the DM code in the vertical direction. The less the deviation, the higher the grade will be. |
NoteThe grade based on this parameter is not included in the overall grade. |
7.6 Image Cache
During live view, you can view the images temporarily saved in the cache list. You can click Image Cache to view these images under different polling parameters. For setting polling parameters, see details in Set Polling. You can also set Cache Capacity to determine the maximum number (up to 10) of images saved in the cache list. When the image number reaches the upper limit, the earliest saved image will be overwritten, and the newly saved image will be displayed as the first image. After you stop live view, you can click an image to view the image and related code reading information in the live view window.
Note
If you switch camera or channel, the image saved in the cache list will be cleared.
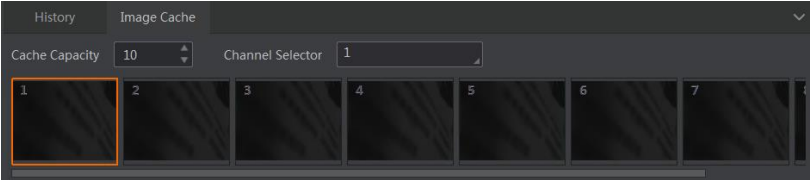
Figure 7-4 Image Cache
7.7 Statistics
During acquisition or live view, you can view the reading status of the device, such as the barcode-read rate.
Steps
1. Connect device(s) to the Software.
2. Start acquisition and live view.
3. Click Statistics on the Control Toolbar to open the Statistics window.
Read Code
The number of the images on which the barcodes are read by the device.
NoRead Code
The number of the images on which the barcodes are NOT read by the device.
Total Code
The total number of the code images.
Read Rate
The barcode-read rate. Formula: Read Rate = Read Code Images / Total Code Images.
Line Graph of Read Rate
The line graph that shows the barcorde-read rate.
Note
Scroll up the mouse on the line to magnify it.
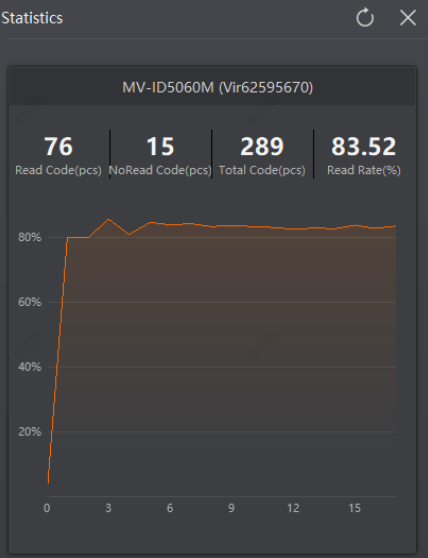
Figure 7-5 Code Reading Statistics
4. Optional: Click  to clear the history statistics and restart the statistics.
7.8 Window Division
Three default window division modes are provided in Custom Division module, i.e., 2 X 2 (4-Window), 3 X 3 (9-Window), and 4 X 4 (16-Window). You can add the three modes to the Window Division panel, or merge (or split) windows based on the three modes.
Steps
1. Click  to display the window division panel.
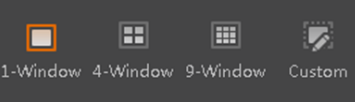
Figure 7-6 Window Division
2. Click Custom to open the Custom Division window.
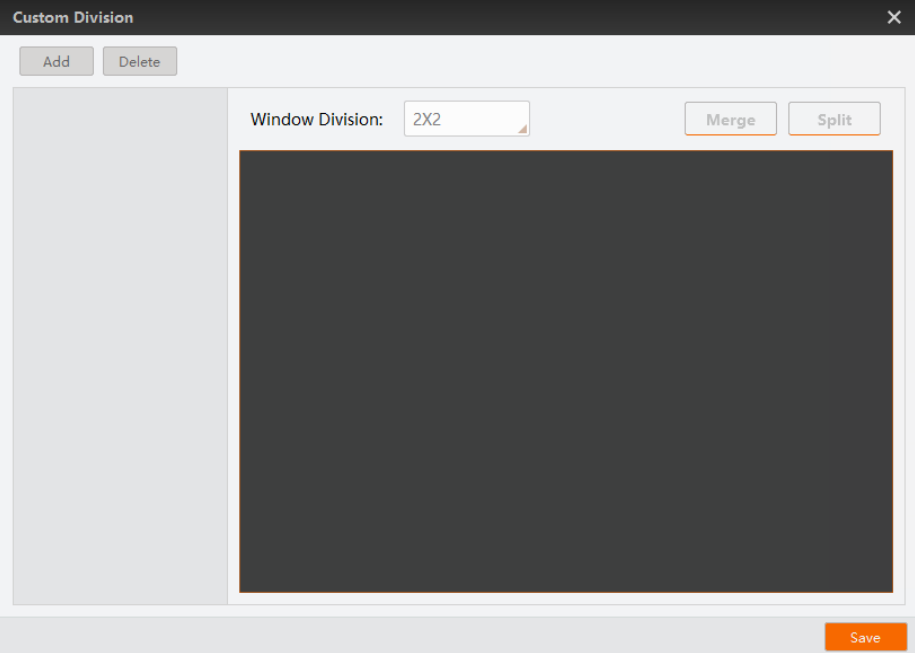
Figure 7-7 Custom Division
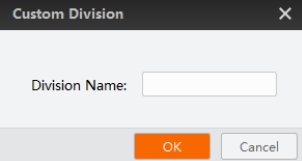
Figure 7-8 Division Name
4. Create a name for the window division mode and then click OK.
5. Select a window division mode in the Window Division drop-down list.
6. Optional: Merge or split windows.
1) Select windows.
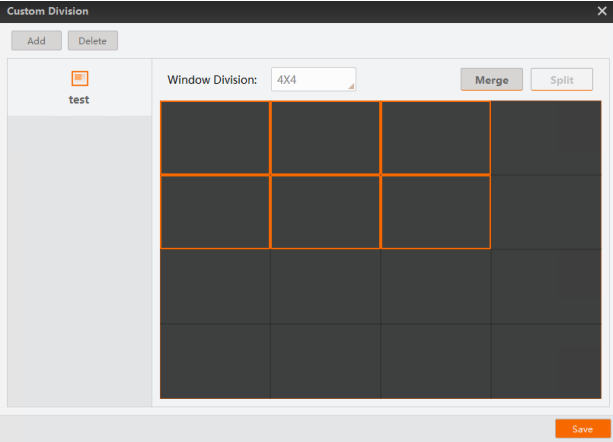
Figure 7-9 Select Windows
2) Click Merge to merge the selected windows into a larger one.
Note
You can merge the selected windows only when the combination of the selected windows is in rectangle shape.
3) Optional: Select the merged window and then click Split to split it into the original number of windows.
7. Click Save.
The customized window division mode will be displayed on the window division panel.
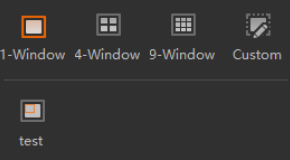
Figure 7-10 Custom Division Added
7.9 Capture and Recording
During live view, you can capture a picture and continuously capture pictures (or record video files).
Steps
1. Start live view.
2. Perform the following operations.
Click to capture a picture and save the picture to the local PC. Click  to continuously capture pictures of the live view, and click the icon again to stop capturing.
Note
During capturing, the number of the captured pictures will be displayed in real time, and you can click  at the upper-right side of the display window to view the buffer usage, number of frame processed and frame dropped.
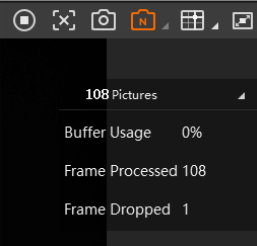
Figure 7-11 Continuous Capture Status
Click (beside ) and then click  to start recording. Click the icon again to stop recording.
Note
During recording, the recording time will be displayed, and you can click at the upper-right of the display window to view the buffer usage, number of frame processed and frame dropped.
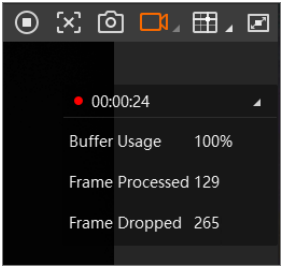
Figure 7-12 Recording Status
A prompt will pop up once you finish capturing picture(s) or recording.
3. Optional: Click View on the prompt to view the picture(s) or video file(s) in the saving path.
Note
You can set the saving path of the captured picture(s) and recorded video file(s). You can also set other parameters for recording or continuous capture. See Capture and
Recording Settings for details.
7.10 Set Cross Line
During live view, you can display a cross line on the live view image to adjust the position of the object in the view.
Steps
The function is only available during the live view of a single camera under 1-window mode.
1. Select a camera and start the live view.
Note
See Acquisition and Live View in 1-Window Mode for details about how to start the live view.
2. Click  to display the cross line on the live view window.
3. Click (next to ) to open the settings window.
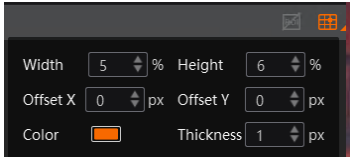
Figure 7-13 Cross Line Settings
4. Set the cross line parameters, including width, height, offset X, offset Y, color, and thickness. The cross line will change simultaneously as you change the parameters.
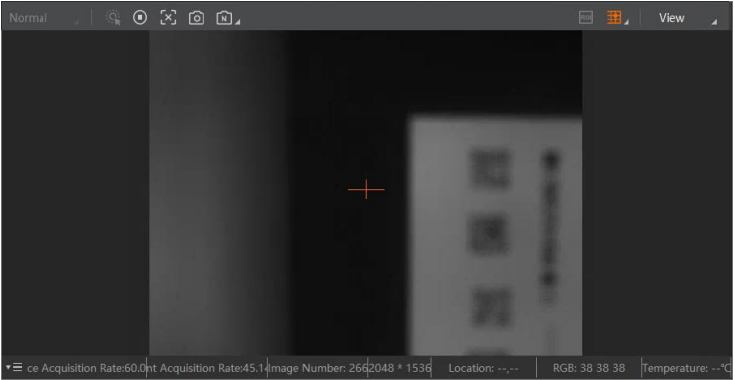
Figure 7-14 Cross Line
7.11 Acquisition Status
During acquisition or live view in 1-window mode, you can view the acquisition status of the device(s) in real time at the bottom of the live view window, including the acquisition rate, image number, resolution, location, and RGB.
Steps:
1. Start live view of a device.
Note
See Acquisition and Live View in 1-Window Mode or Multiple-Camera Acquisition (and Live View) for details about how to start the live view.
2. Click  in the lower-right corner of the live view window to open the parameter panel.
3. Check the checkbox(es) to select the parameter(s) to be displayed on the status bar.
Algorithm rate
The code reading frame rate of the algorithm embedded in the camera.
Transmission rate
The frame rate of outputting code reading results via protocols.
Image Number
The number of collected images.
Resolution
The resolution of the current image.
Location
Move the cursor on the image to show the location of the cursor (unit: pixel). You can use the function to view the locations of the barcodes.
RGB
Move the cursor on the image to show the RGB value of the spot where the cursor locates. You can use the function to view the color of the barcodes.
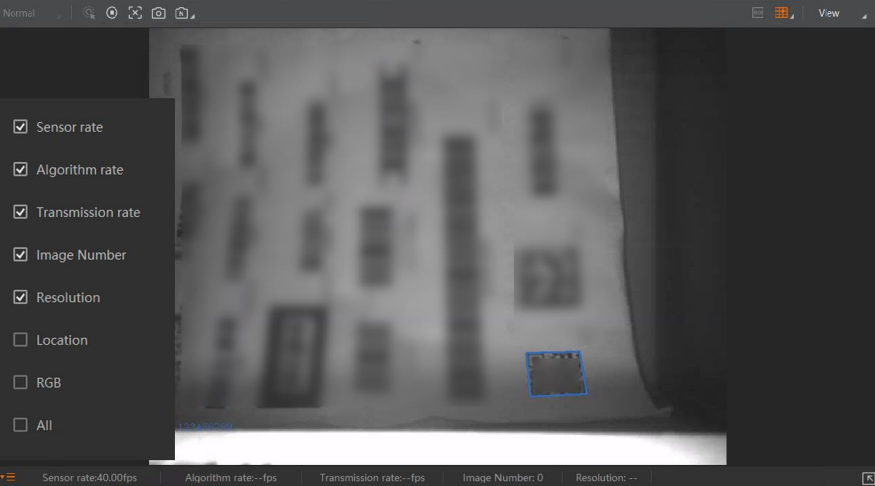 Figure 7-15 Acquisition Status
7.12 More Functions
During live view, you can perform other operations such as digital zoom and rotating image. You can perform more functions by selecting the function from the drop-down list in the upper right corner.
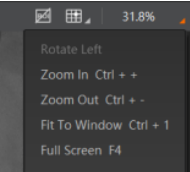
Figure 7-16 More Functions in Live View
● Digital Zoom: Right-click the image and then click Zoom in / Zoom out, or select Zoom in / Zoom out from the drop-down list in the upper-right corner to zoom in or zoom out the image.
● Adjust Image Window Size: Right-click the image and then click Fit to Window to fit the size of the image window to that of the display window or click Actual Size to set the size of the image window to its actual size. You can also select Fit to Window/Actual Size from the drop-down list in the upper-right corner or press shortcut keys to adjust the image window size.
● Rotate Image: Right-click the image and then click Rotate Left/Rotate Right to rotate the image to the left/right. You can also select Rotate Left / Rotate Right from the drop-down list in the upper-right corner to rotate the image to the left/right.
● Display ROI/Close ROI: Click  on the upper right to display or close the algorithm ROI in live view.
Note
You can draw algorithm ROI in the Algorithm Settings. For details, refer to Algorithm ROI
No comments to display
No comments to display